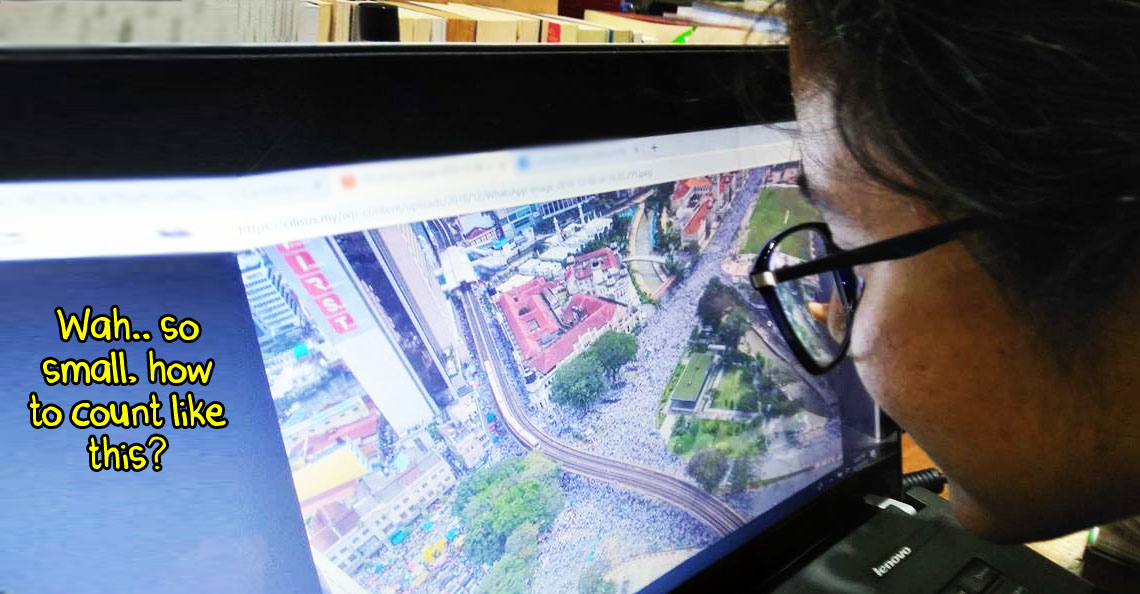
How many people actually went for the anti-ICERD rally? We tried counting
- 789Shares
- Facebook719
- Twitter7
- LinkedIn12
- Email10
- WhatsApp41
Now that the anti-ICERD rally is over, y’all would’ve wondered…
“How many people went for the rally ah?”
Even if you weren’t, we want you to wonder. The rally organisers were hoping to get 500,000 attendees.. but the rally director Kamaruzaman Mohamad said that 300,000 people actually showed up by 2pm. But this figure wasn’t aligned with the other figures that other peeps gave.
Police said 55,000.. Malaysiakini said 80,000.. Naseron Ismail said 350,000.. Zahid Hamidi said 500,000?! Just like the Bersih 4.0 demo a few years ago, there are sooooo many different figures that we dunno which is right or wrong.
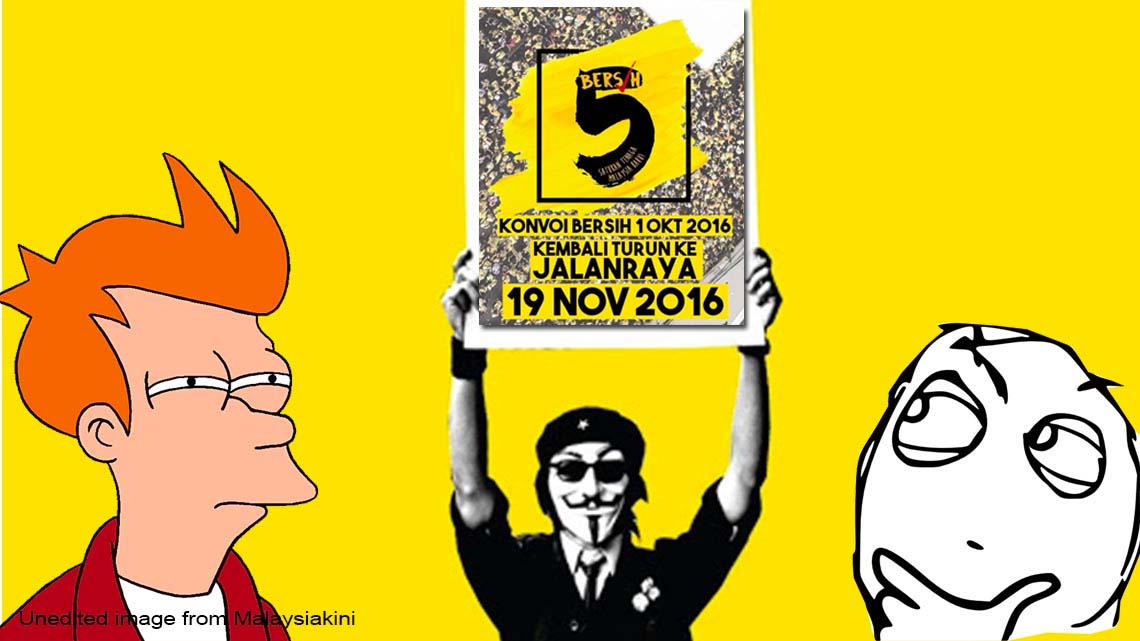
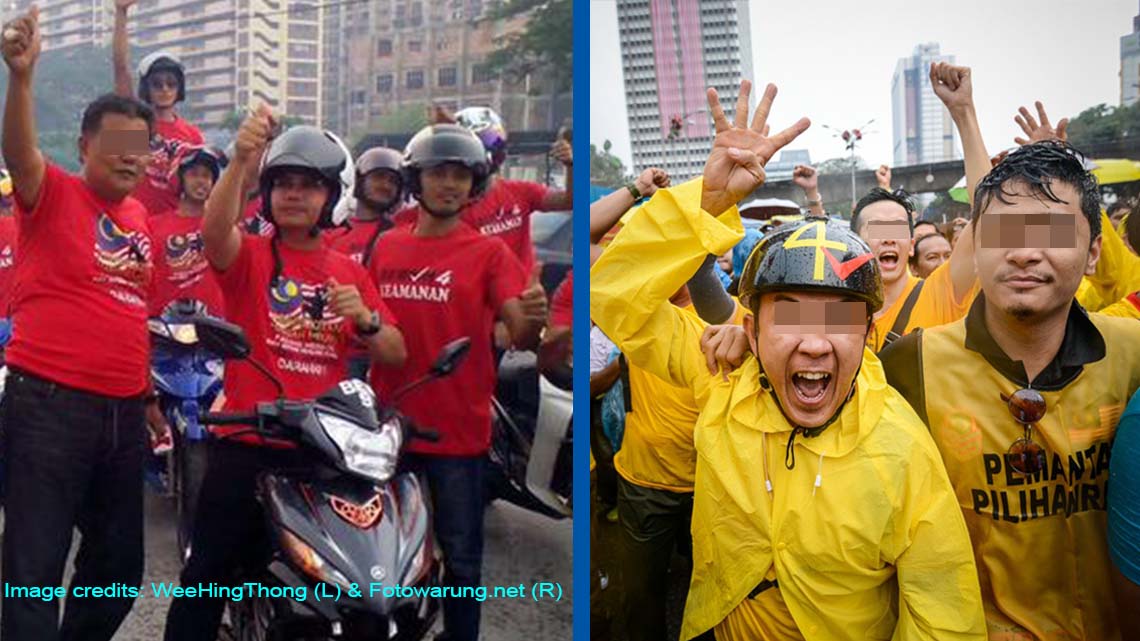
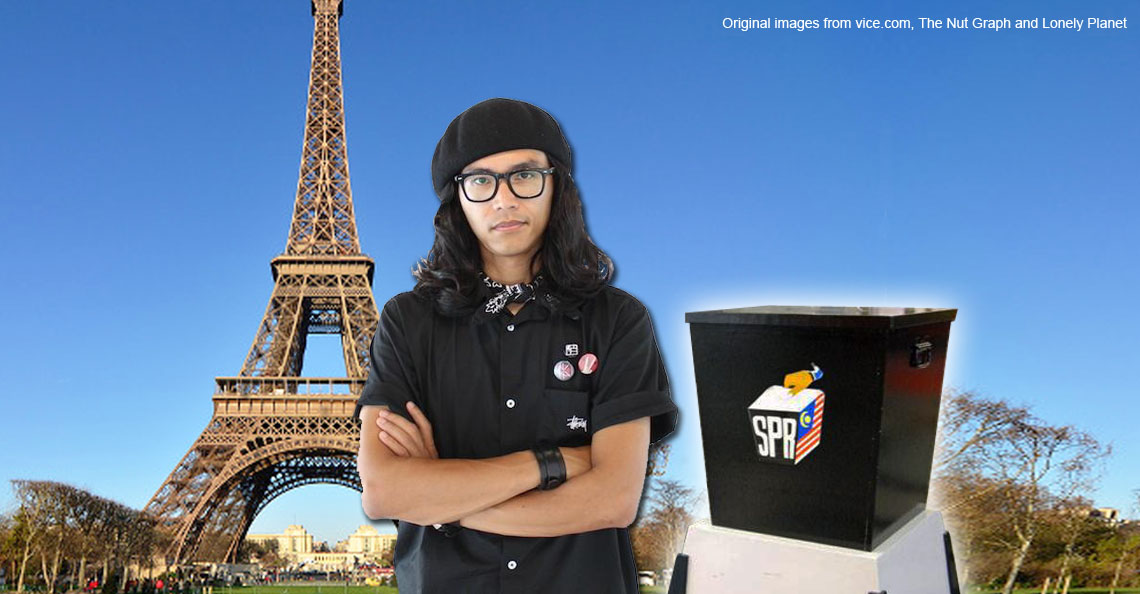
So, we tried to do the counting ourselves, which we’ve done before for Bersih 4.0, so you can count on us (hopefully). But instead of counting the number of heads manually like last time (or its number based on the number of pixels per head like what one of the interns wanted to do), we’re gonna learn from our mistakes and jump straight to this method!
No way we could #kirasampaigila, so we tried something more.. scientific?
So, instead of…
… we used the ‘The Jacobs’ Method’, which is a crowd estimation technique by Herbert Jacobs. His method has been used for everything from political gatherings to concerts, and is a generally accepted way to count crowds worldwide.
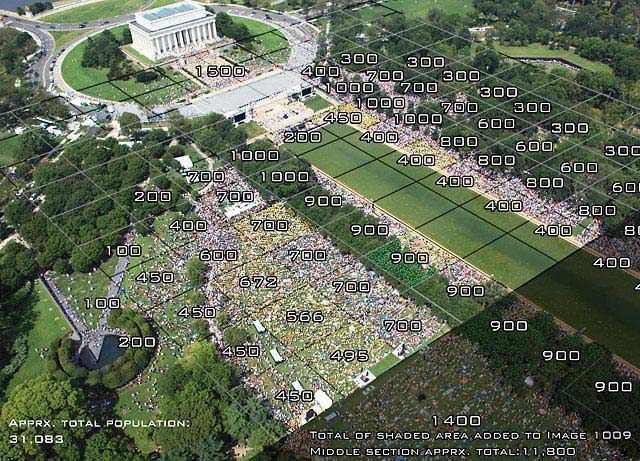
We’ve explained this method in our past article about the Bersih 4.0 figures but we’ll go thru it again for y’all laa k. This method uses a simple basic principle: area x density. The density is calculated based on how much space a person takes up in a crowd. And to determine this, there are 3 different types of crowd density.
- Light crowd – 0.93 square meter/person
- Dense but manageable crowd – 0.42 square meter/person
- Mosh-pit density crowd – 0.23 square meter/person
Due to time constraints and footage limitations, we decided to compare the crowd density of the Bersih 4.0 and anti-ICERD demos through photos. We found that the crowd density between the two events were pretty similar, so we chose the 2nd one, where 1 person occupies 0.42m2.
Now, to make the crowd density assumption stand, there are things we considered and things we didn’t.
Considered:
- We only considered areas that looked PACKED.
- We compared the crowds of Bersih 4.0 and anti-ICERD.
- We viewed one video that showed us where most of the people were at 2pm.
Not considered:
- Sparse areas.
- Areas not recorded on camera.
- Movements of peeps at different times of the day.
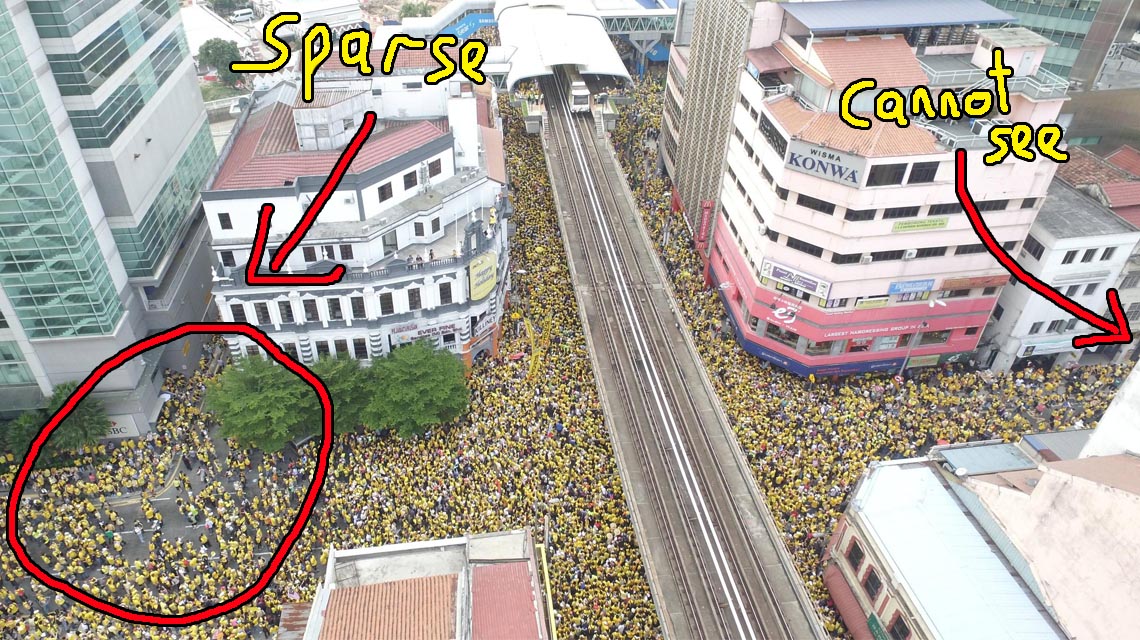
When we said that there were movements at different times, we meant people who came and left for different reasons. One was the different checkpoints on their location plan, where some of them went to these checkpoints first and some moved towards Jalan Raja.
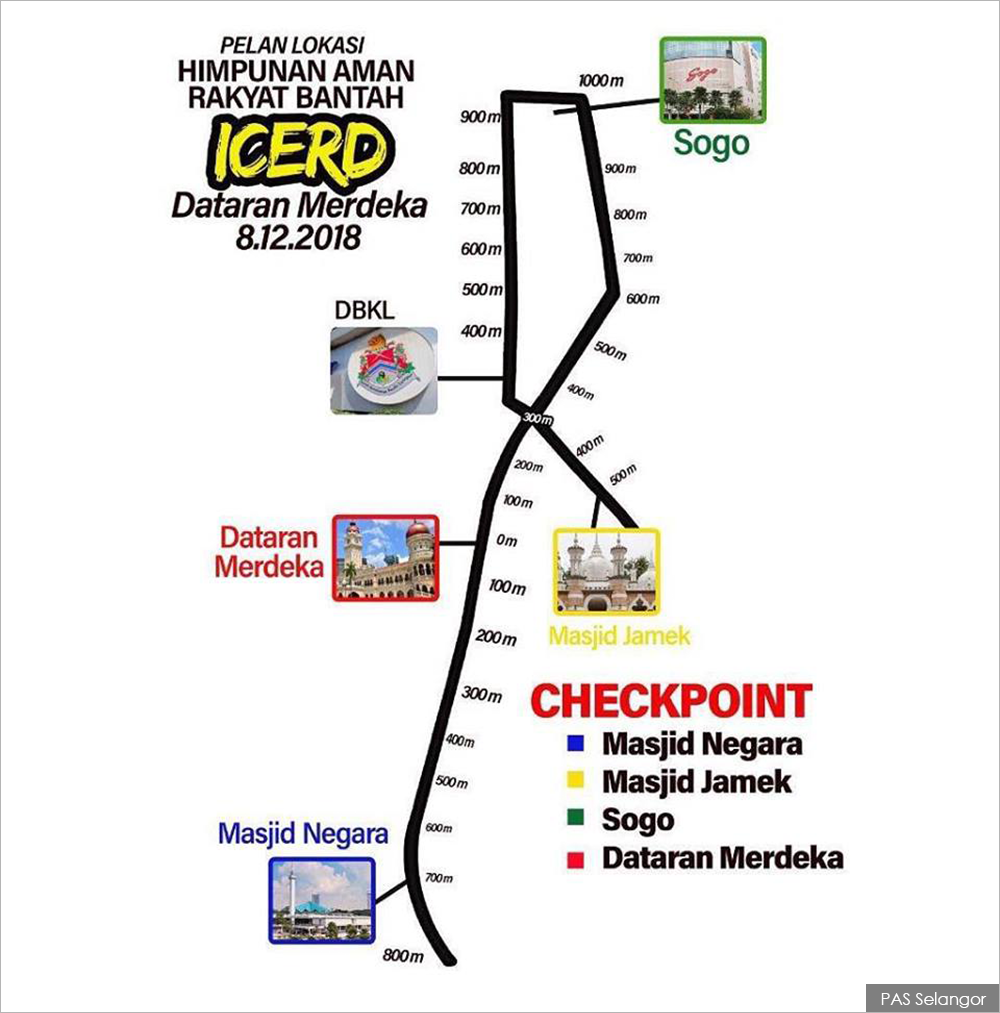
So we left out peeps who were lingering in other areas like Sogo, Masjid Jamek and Masjid Negara since their movements are pretty hard to track. Other reasons included the rainstorm and some peeps fainting.
And just to admit one thing: we did torture the interns into counting manually but they failed (obviously). Here’s why they couldn’t get a figure from counting manually (thanks, interns!):
- Lots of moving here and there.
- Some sat while some stood.
- Some peeps brought their kids and little kids are like harder to spot in crowds.
- Almost everyone wore white, so they couldn’t tell if it’s one person or two people.
- Many wore headwear (headbands, tudungs, songkoks, caps etc), so they couldn’t just count the number of black circles (cos of generally black hair) and the colours of the headwear may have blended into the crowd.
- They couldn’t figure out how many people were under the trees and umbrellas.
- The attendees were also facing in different directions, so hard to count face and no face circles.
- AND, one intern complained about the bad resolution of the drone footages.
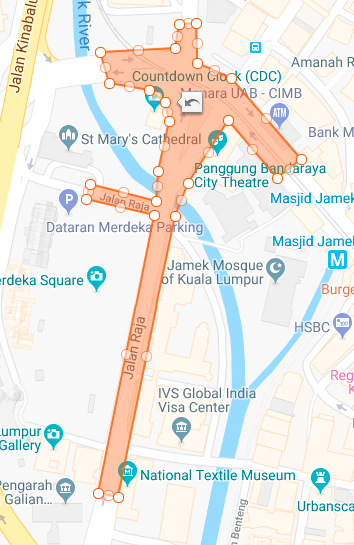
Now, to make up for all the parts that weren’t considered, we’ll add 20% to our figure, just like how it was done for the Bersih article’s estimation. So, one last step was to trace out the area using an online tool called MapChecking and calculate.
ESTIMATE OF PEOPLE at 2PM on 8th December 2018
Total area: 28,316.83m2
Crowd density: 0.42m2/person
Number of considered parts: 28,316.83/0.42 = 67,421
An additional 20% for rough total: 67,421 x 1.2 = 80,905.2
= 80,905 people!
So, among the estimates we mentioned at the start, the closest one (assuming that it is the most realistic) to our calculated figure was Malaysiakini’s estimate of 80,000!
And it’s actually not that different from the Bersih 4.0 crowd.
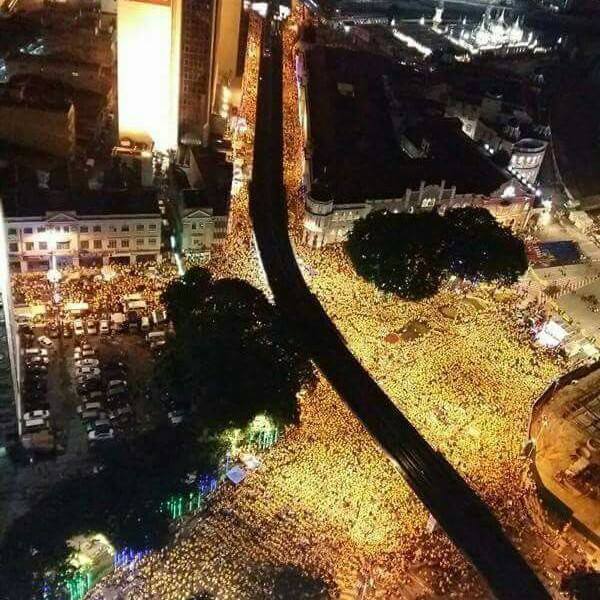
But unlike the big-big news outlets with their ground sources to help their estimation models, our estimate was more of a “guesstimate” that may not be 100% accurate (although we know some peeps who attended and could tell us roughly the movements of the crowds).
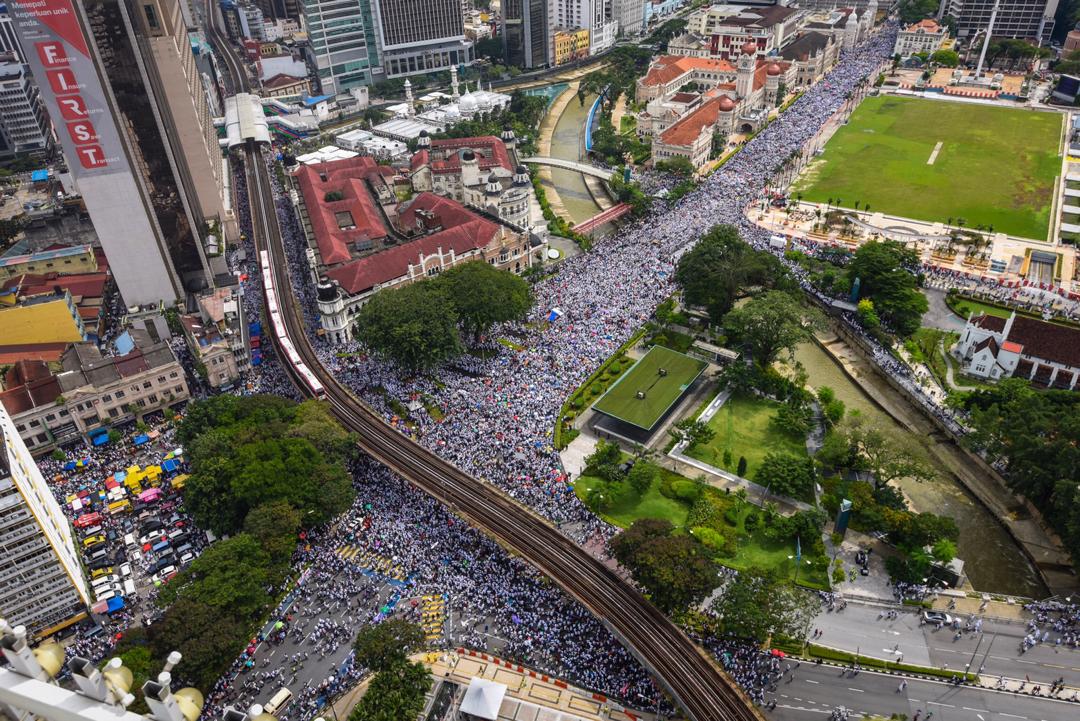
But still.. Do y’all agree with this estimate? Let us know. If you don’t agree and want to try counting the number yourself, then you can try using the image below if you free… 😉
- 789Shares
- Facebook719
- Twitter7
- LinkedIn12
- Email10
- WhatsApp41

